
A BMI chart for men and women helps you quickly check your weight range. BMI stands for Body Mass Index. It compares your height to your weight. This guide explains how BMI charts work, what the numbers mean, and if men and women use different charts.
You will also see simple examples and learn when to use a BMI chart. To check your BMI fast, visit our tool at BMI Calculator.
What is a BMI chart?
A BMI chart is a table that shows BMI ranges based on height and weight. You find your height on one side and your weight on the other. Where they meet shows your BMI number.
The chart then groups your BMI into categories. These categories are underweight, normal weight, overweight, and obese.
In real projects, BMI charts are used in clinics, gyms, and health apps. They give a quick first look at weight status.
Standard BMI categories (for adults)
Most BMI charts use the same categories worldwide. Here are the common ranges:
-
- Underweight: BMI less than 18.5
- Normal weight: BMI from 18.5 to 24.9
- Overweight: BMI from 25.0 to 29.9
- Obese Class I: BMI from 30.0 to 34.9
- Obese Class II: BMI from 35.0 to 39.9
- Obese Class III: BMI 40.0 or higher
These ranges help identify possible health risks. They do not diagnose any condition.
Do men and women use different BMI charts?
In most cases, men and women use the same BMI chart. The standard adult BMI categories apply to both. The cutoff numbers (like 18.5, 25, 30) are the same.
But there are a few important differences to know.
Body composition differences
Men typically carry more muscle. Women usually have more body fat for the same BMI. This is normal and healthy.
So two people with the same BMI can have different body fat percentages. A man with BMI 26 might have more muscle. A woman with BMI 26 might have more body fat.
Health risk differences
From practical use, doctors know that health risks can show up differently. For example, waist size and where fat sits matters a lot. Men often store fat around the belly. Women often store it around hips and thighs before menopause.
Some studies suggest lower BMI cutoffs for certain groups. But most BMI charts stay the same for men and women.
How to read a BMI chart (step by step)
Reading a BMI chart is simple. Follow these steps:
-
- Find your height in the left column (in feet and inches or centimeters).
- Move across the row to find your weight (in pounds or kilograms).
- The number where they meet is your BMI.
- Check which category your BMI falls into.
If you prefer to skip the chart, use the BMI calculator at BMI Calculator for instant results.
Simple BMI examples (men and women)
Examples make BMI easier to understand. Here are three common cases.
Example 1: Woman with normal BMI
-
- Height: 5 feet 4 inches (about 163 cm)
- Weight: 140 pounds (about 64 kg)
- BMI: approximately 24.0
- Category: Normal weight
This falls in the healthy range for most adults.
Example 2: Man with overweight BMI
-
- Height: 5 feet 10 inches (about 178 cm)
- Weight: 190 pounds (about 86 kg)
- BMI: approximately 27.3
- Category: Overweight
This is above the normal range. But if the person has high muscle, BMI may not tell the full story.
Example 3: Woman with underweight BMI
-
- Height: 5 feet 6 inches (about 168 cm)
- Weight: 110 pounds (about 50 kg)
- BMI: approximately 17.7
- Category: Underweight
This is below the healthy range. It may need attention or follow-up.
What BMI charts can (and cannot) tell you
BMI charts are helpful screening tools. But they have limits.
What BMI charts show
-
- A quick weight range based on height
- Broad categories for health screening
- Trends over time if you track regularly
What BMI charts miss
-
- Muscle versus fat (body composition)
- Where fat is stored (belly, hips, etc.)
- Age-related changes in body
- Bone density and overall fitness
In most businesses and clinics, BMI is just one piece of the puzzle. It works best with other checks.
When BMI charts may not fit
BMI charts work well for average adults. But some people need different tools.
BMI may be less accurate for:
-
- Very muscular people (athletes, bodybuilders)
- Older adults with low muscle mass
- Pregnant or breastfeeding women
- Children and teenagers (they use growth charts)
- People with certain health conditions
If you fall into one of these groups, talk to a health professional. They can give better guidance.
How men and women can use BMI charts wisely
From practical use, BMI is most helpful when you combine it with other signs. Here are smart tips:
-
- Track your BMI over months, not just once.
- Measure your waist size too. High waist size adds risk.
- Notice how your clothes fit and how you feel.
- Consider your activity level and diet quality.
- Ask a doctor if you have health concerns.
For men, watch belly fat especially. For women, changes around menopause can shift where fat goes.
Quick BMI calculation (without a chart)
You can calculate BMI with a simple formula. Here it is:
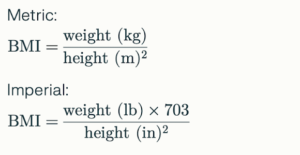
Or skip the math and use our tool at BMI Calculator. It shows your BMI and category instantly.
BMI chart tips for weight goals
If you want to change your weight, a BMI chart can help set targets. But be realistic.
For weight loss:
-
- Aim for the middle of the normal range (BMI around 21 to 23).
- Focus on healthy habits, not just the number.
- Track progress weekly or monthly.
For weight gain:
-
- Aim to reach at least BMI 18.5.
- Build muscle with strength exercises.
- Eat balanced meals with enough calories.
Check your BMI now
Want to see where you stand? Use the BMI calculator at BMI Calculator. It takes seconds. You enter your height and weight, and it shows your BMI and category right away.
Conclusion
A BMI chart for men and women is a simple tool to check your weight range. Men and women use the same standard categories in most cases. But body composition and health risks can differ. Use BMI as a starting point, not the final answer. For a fast BMI check, try our calculator at BMI Calculator.
FAQ: BMI Chart for Men and Women
1) Is the BMI chart the same for men and women?
Yes. The standard adult BMI chart uses the same categories for both. But men and women may have different body composition at the same BMI.
2) What is a healthy BMI for women?
For most adult women, a healthy BMI is 18.5 to 24.9. Personal health can vary, so this is a general guide.
3) What is a healthy BMI for men?
For most adult men, a healthy BMI is also 18.5 to 24.9. Muscle can affect the number, so it is not perfect for everyone.
4) Can BMI charts be wrong?
BMI charts can be less accurate for very muscular people, older adults, and some ethnic groups. They do not measure body fat directly.
5) Should I use a BMI chart if I am pregnant?
No. BMI charts are not used the same way during pregnancy. Talk to your doctor for guidance on healthy weight gain.